See what your changes did
to your metrics
Connect PostHog. Loupe correlates every page change with your analytics, so you know whether each change helped or hurt.
Already monitoring pages? Connect PostHog to see metric correlations.
Connect PostHog in 2 minutes
API key, Project ID, host. That's it.
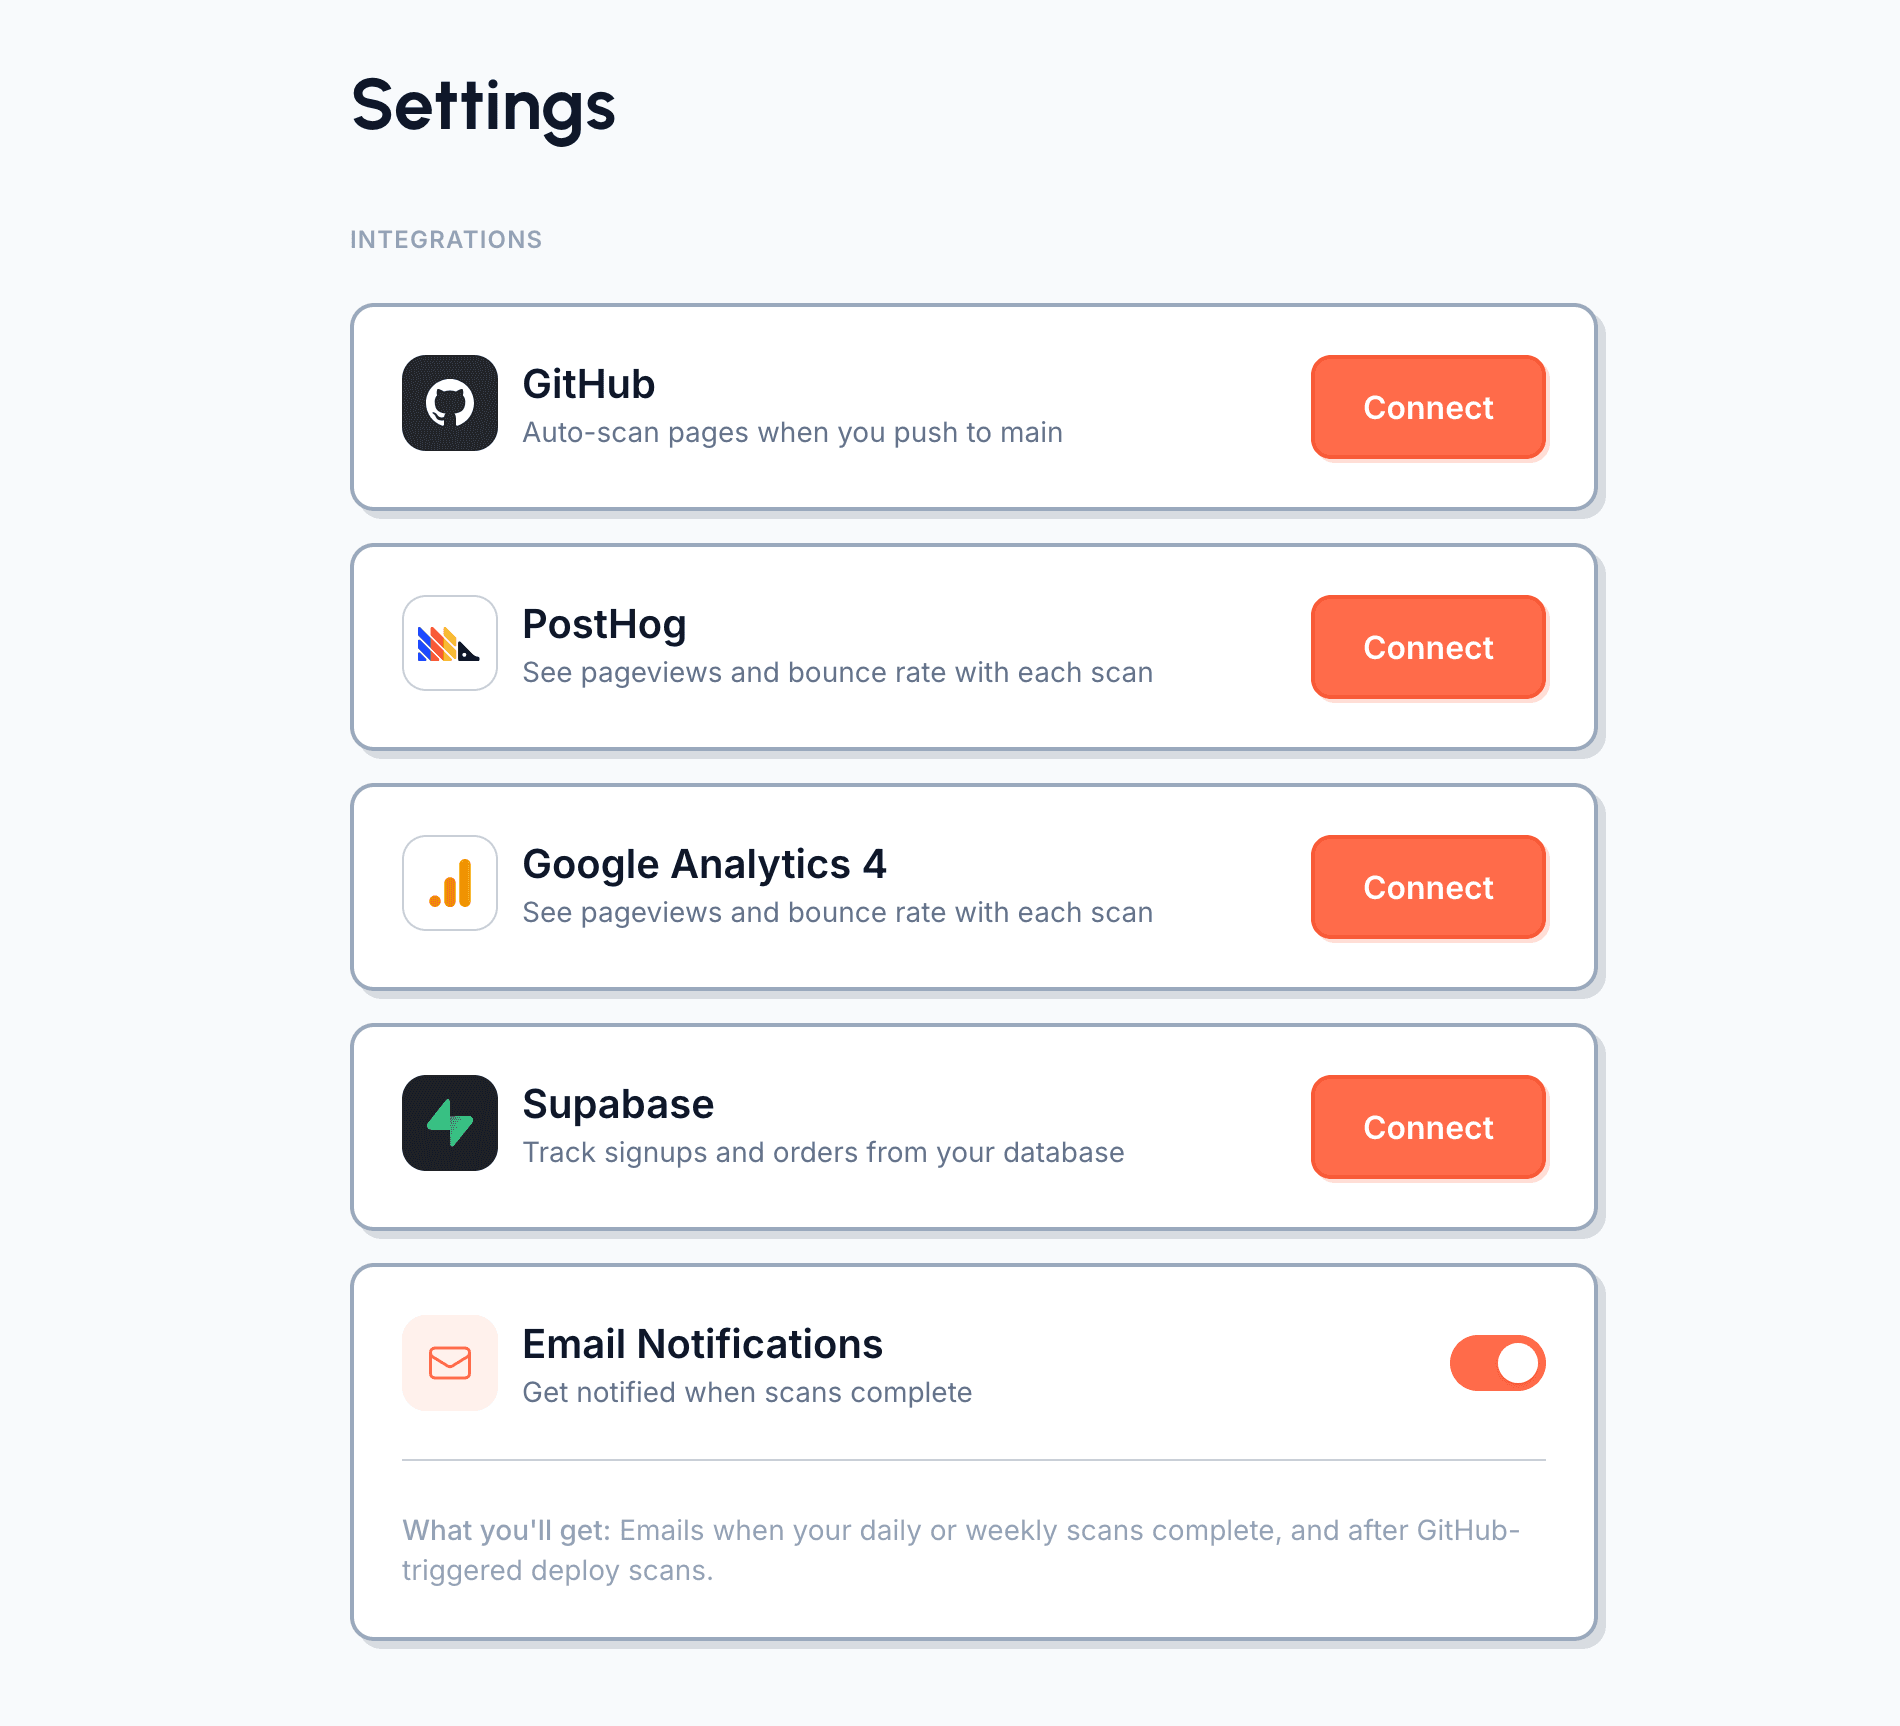
Go to Settings → Integrations
Open your Loupe dashboard and head to Settings. You'll see a PostHog section with a Connect button.
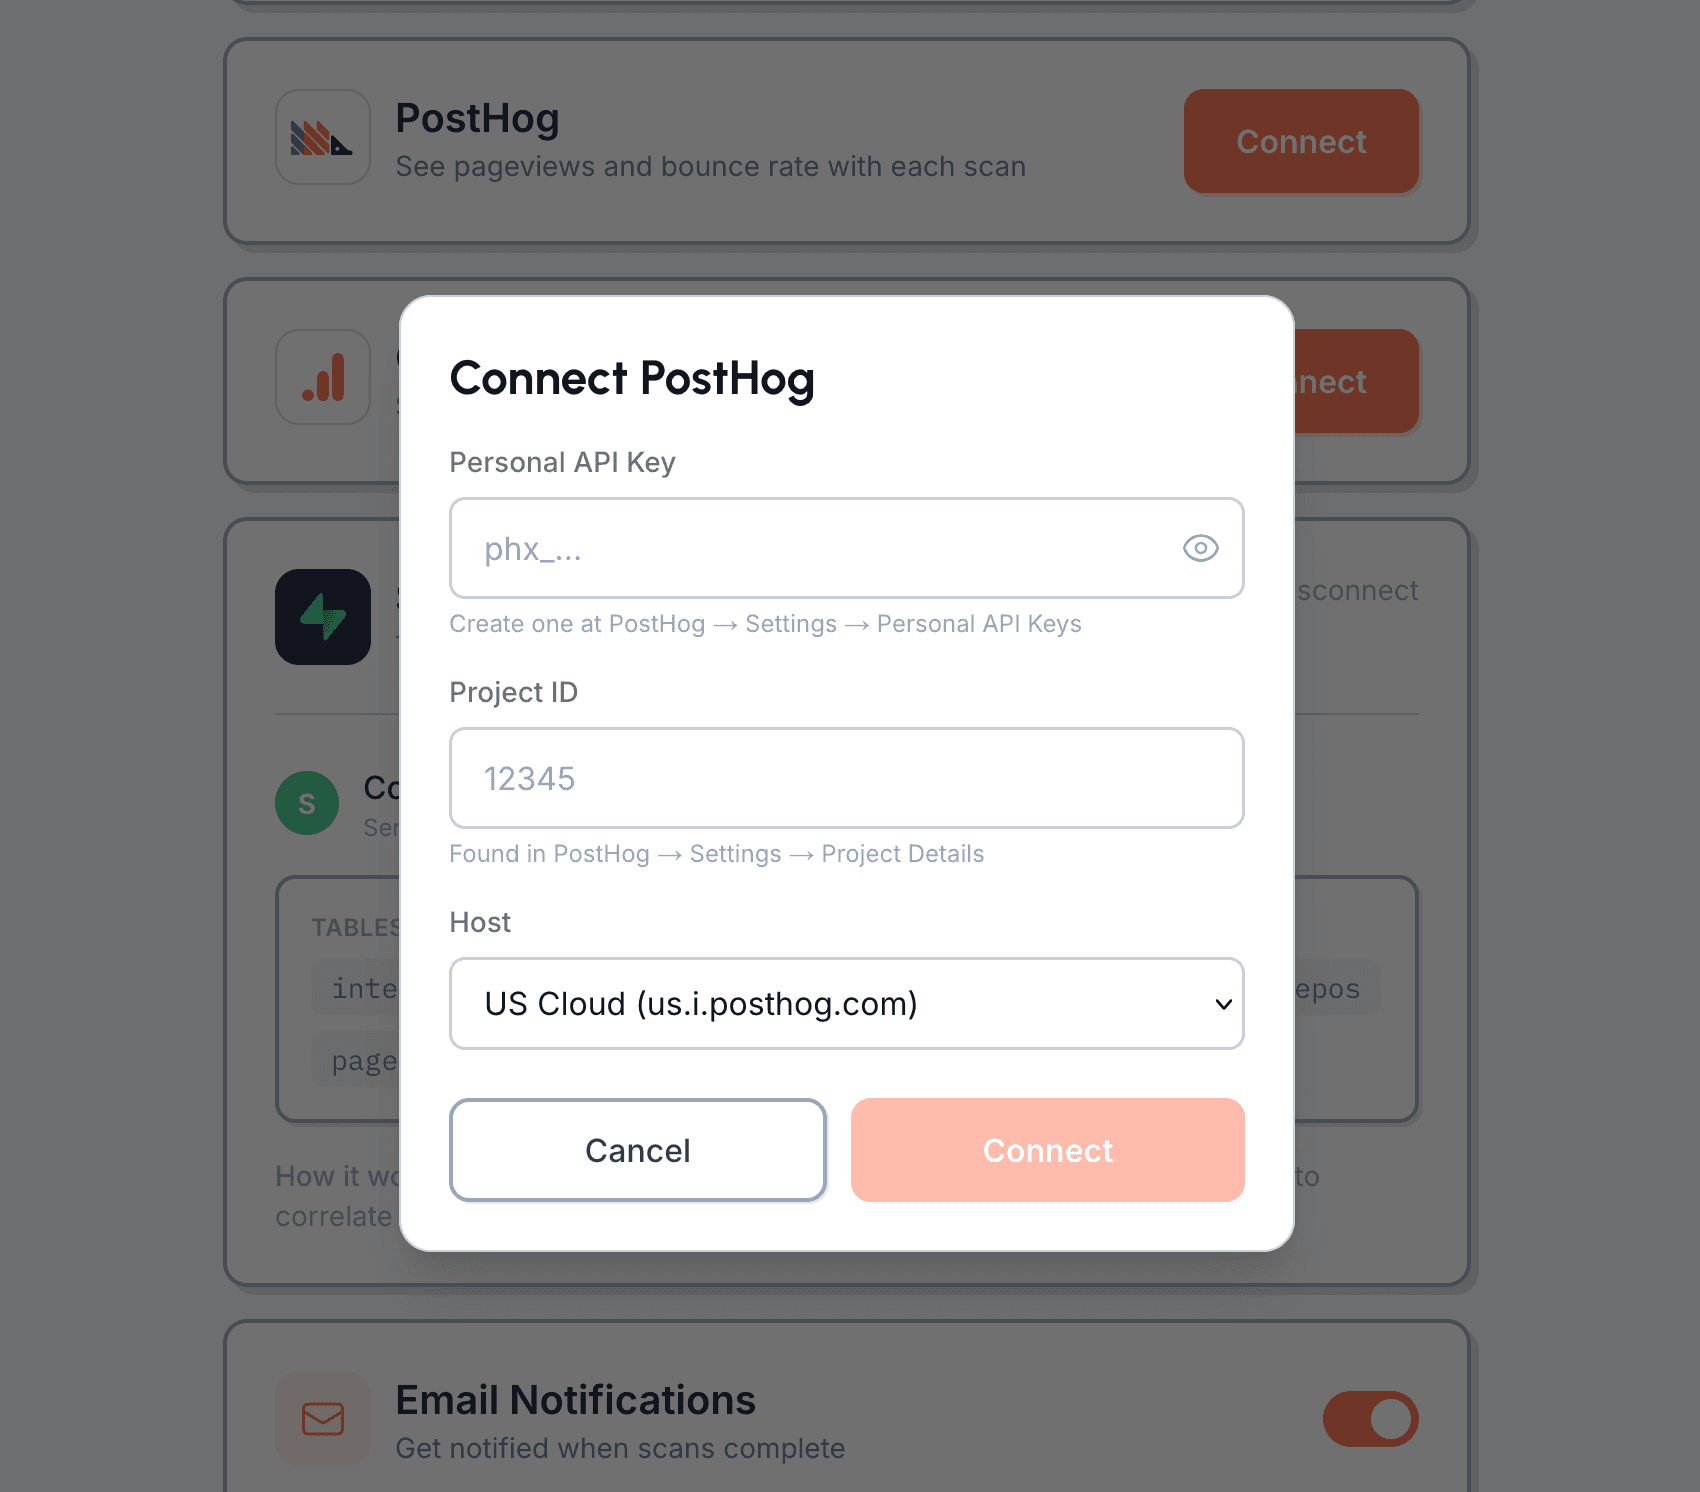
Enter your PostHog credentials
Click Connect to open the setup modal. You'll need your Personal API Key (create one at PostHog → Settings → Personal API Keys), your Project ID, and your host (US Cloud, EU Cloud, or self-hosted).
Ready to connect your analytics?
What permissions does the API key need?
A Personal API Key with read access. Loupe reads pageview and event data to correlate with detected changes. We never write to your PostHog project.
What data does Loupe read from PostHog?
Pageviews, custom events, and basic session metrics for the pages you monitor. We pull data for a window around each detected change to calculate before/after comparisons.
How long until I see correlation data?
After your next scan detects a change, Loupe pulls metrics for the period before and after. You'll see correlation data within a few days of a detected change, once enough post-change data exists.
Does it work with PostHog Cloud and self-hosted?
Yes. During setup you choose US Cloud, EU Cloud, or enter your self-hosted URL. All three are fully supported.
Can I connect PostHog and GA4 at the same time?
Yes. You can connect both. Loupe will pull metrics from whichever source has data for the pages you monitor.
Can I disconnect anytime?
Yes. Remove the connection in Loupe settings. Your existing scan history and correlation data remains available.
What does it cost?
PostHog can be connected on any paid plan. Analytics correlation requires Pro ($39/month) or Scale ($99/month).